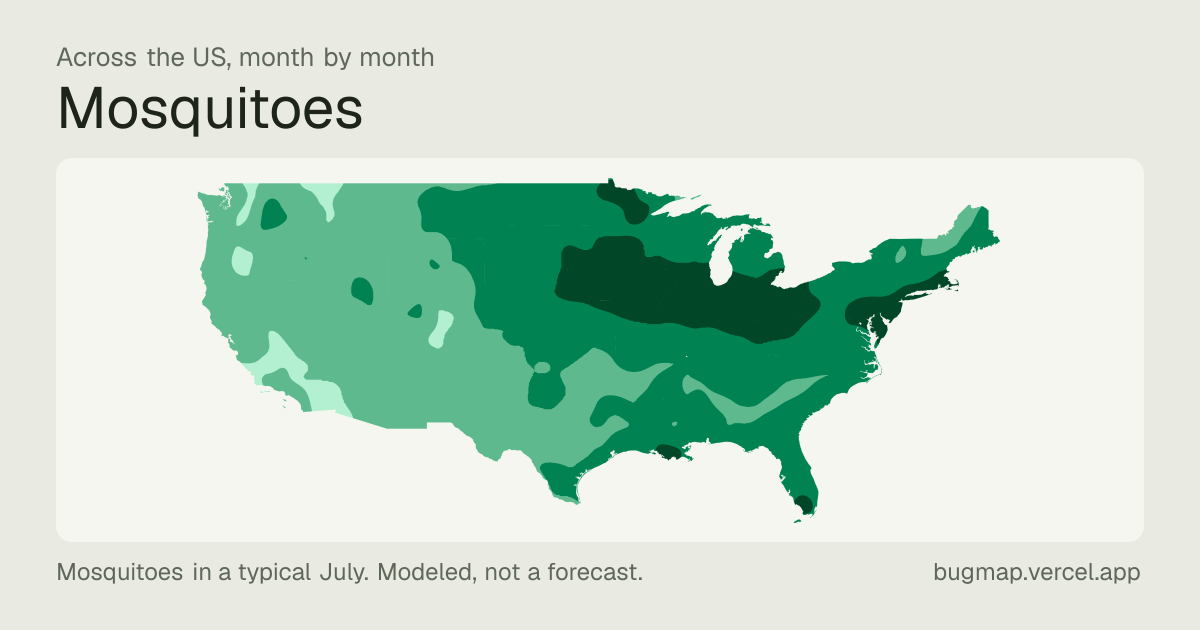
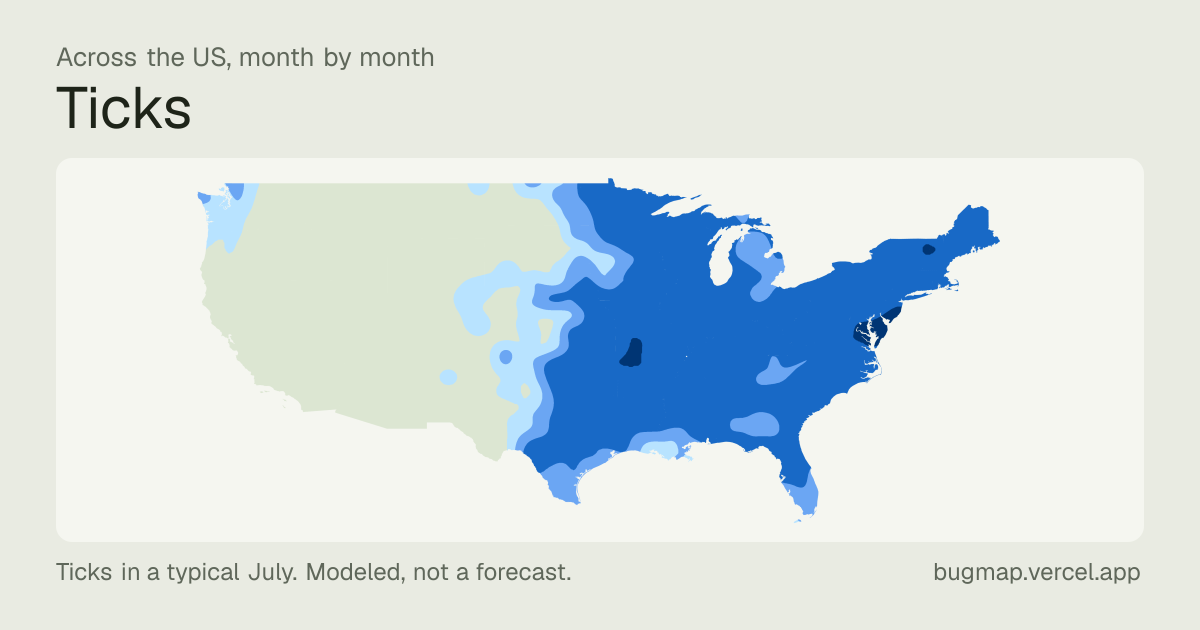
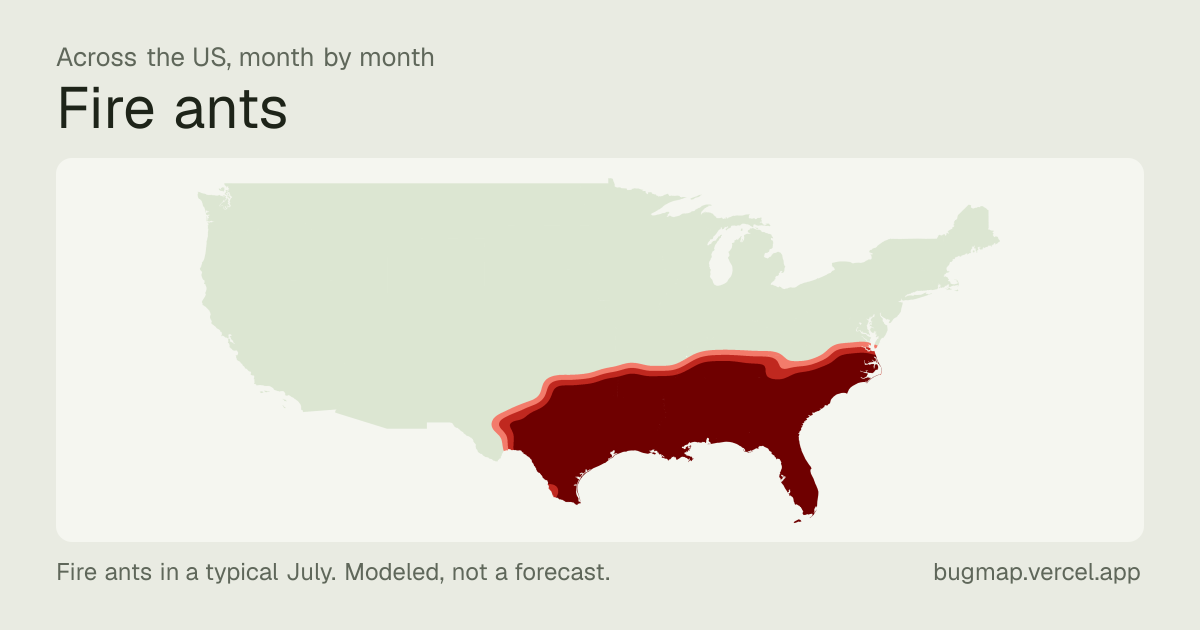
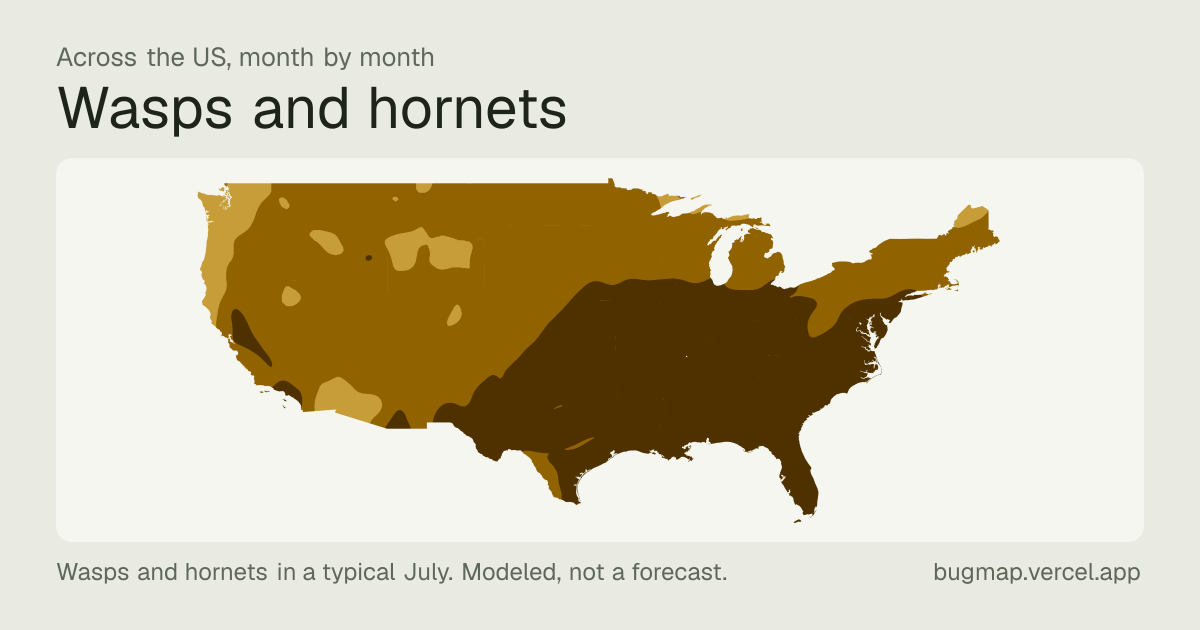
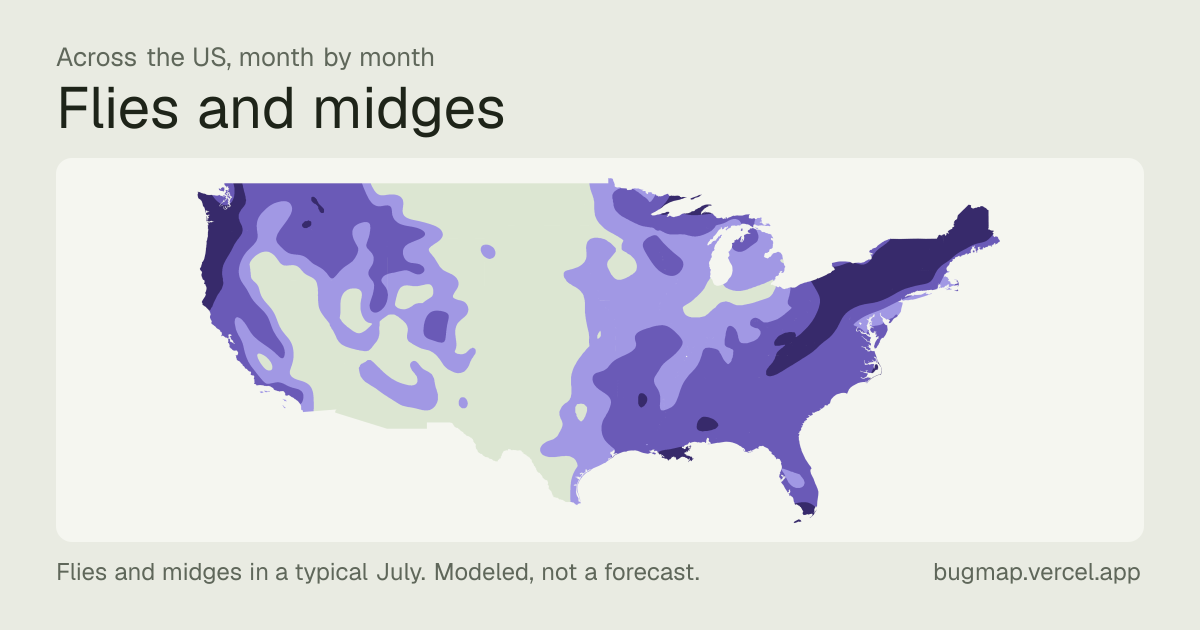
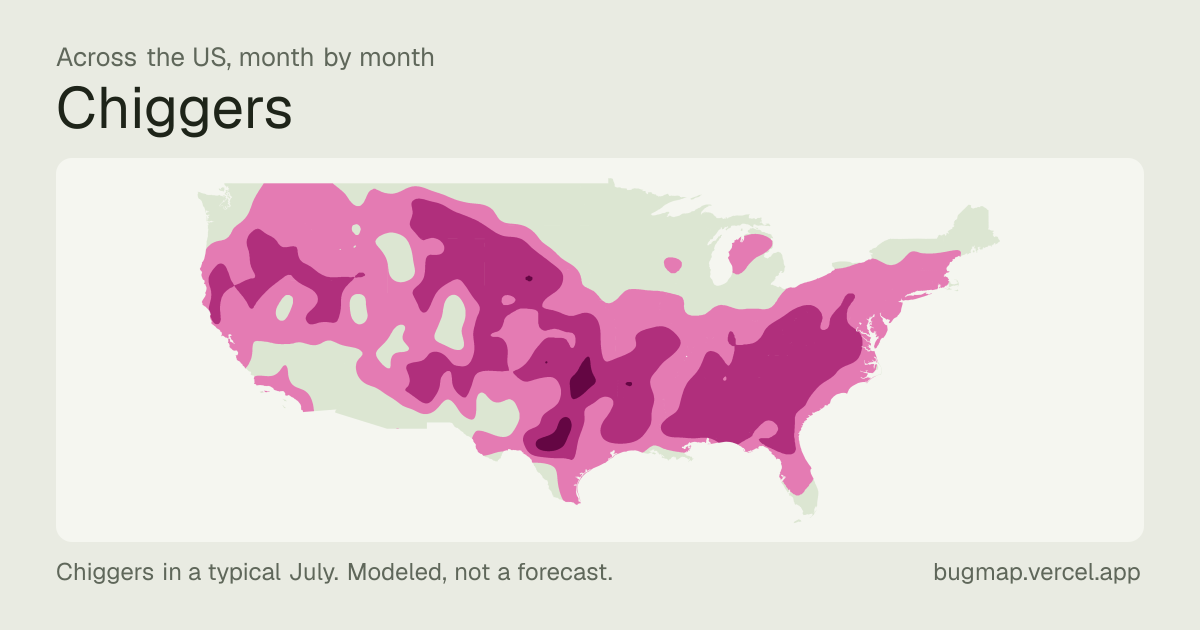
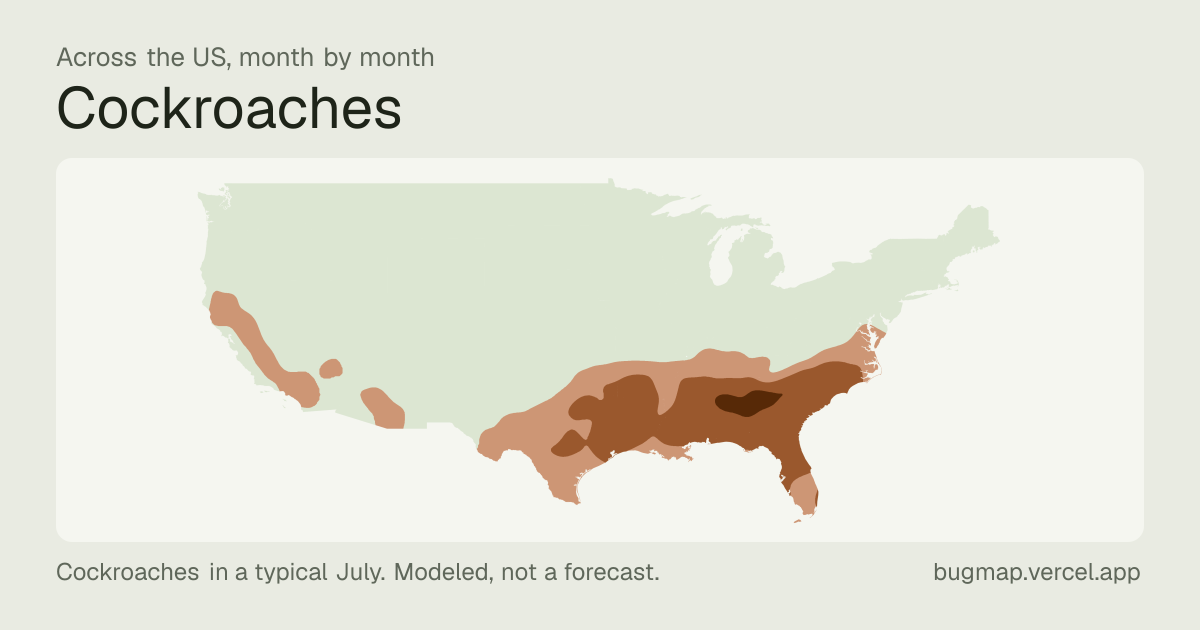
We have a local figure for every metro area in the lower 48 states. Everything here is free to use with credit and a link.
The short version
What it is. A model of when mosquitoes, ticks and other biting and stinging bugs are out, by month and by hour, for every large metro area in the lower 48 states.
What it rests on. Climate records for 1991–2020, laboratory studies of how each insect responds to temperature, and field trap counts where they exist. The method in full
What it describes. A typical year. It isn’t a forecast for this one, and a wet spring or a late frost will move the real season.
What it never describes. Disease. We say when ticks are active, not how likely anyone is to catch anything.
Your city’s figures
Each city’s page says how long every season runs there and where that places it among them all. Type a city to go straight to those lines.
Or see every city in one list, which filters to a state:
How long a season runs in your city, and where that ranks. “Mosquito season around here runs about 30 weeks in a typical year, longer than in most big cities.”
When a season typically opens and closes, and how that differs across your state.
What hours a bug keeps. Each city page charts the whole year by the hour.
For mosquitoes only, which cities have more at the height of the season. That estimate is fit to field trap counts.
What a reader will meet on holiday that they don’t have at home. The comparison page puts up to four cities side by side.
Not supported
Anything about this year in particular. “A bad year for ticks” isn’t something a typical-year model can know.
Disease risk, in any wording.
Which city has the most ticks, fire ants, or any bug other than mosquitoes. For those we estimate the season, not the number.
One bug against another. Each is measured on its own scale.
Places far from a big city. The figures describe metro areas.
How to credit it
“Bugmap (bugmap.vercel.app), modeled estimate for a typical year,” with a link to the page the figure came from. If a story uses tick figures or a tick map, please also carry the credit our source asks for: tick ranges from the ArboNET Tick Module, CDC (2025 county surveillance).
Pictures
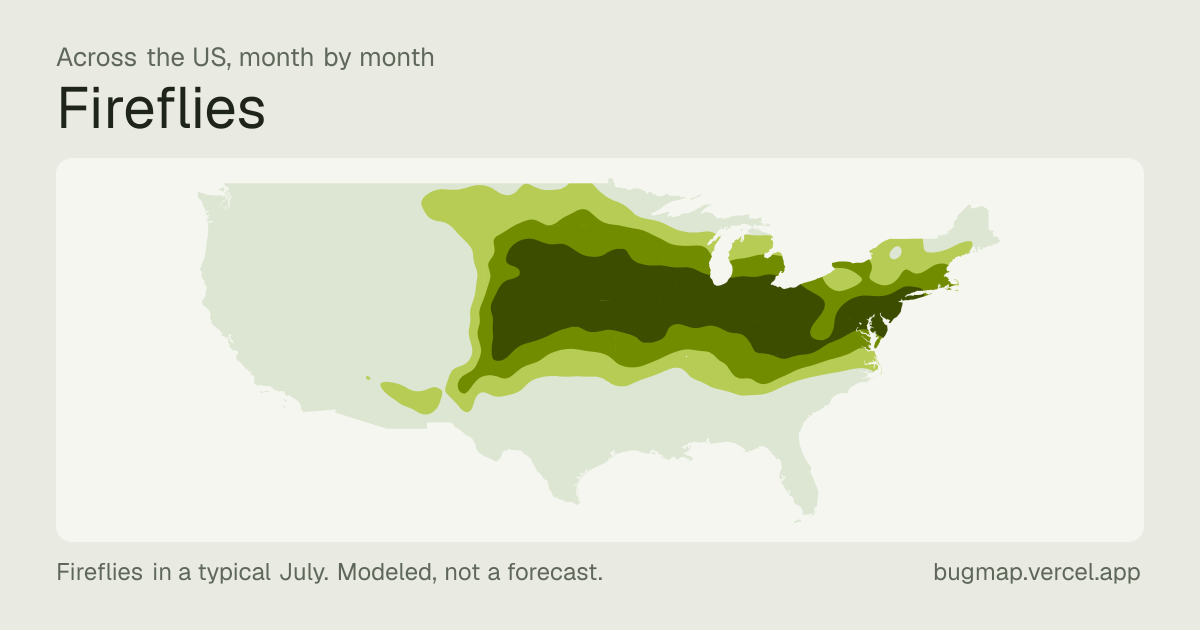
A July map for each bug, 1200 by 630, ready for a story or a social post.
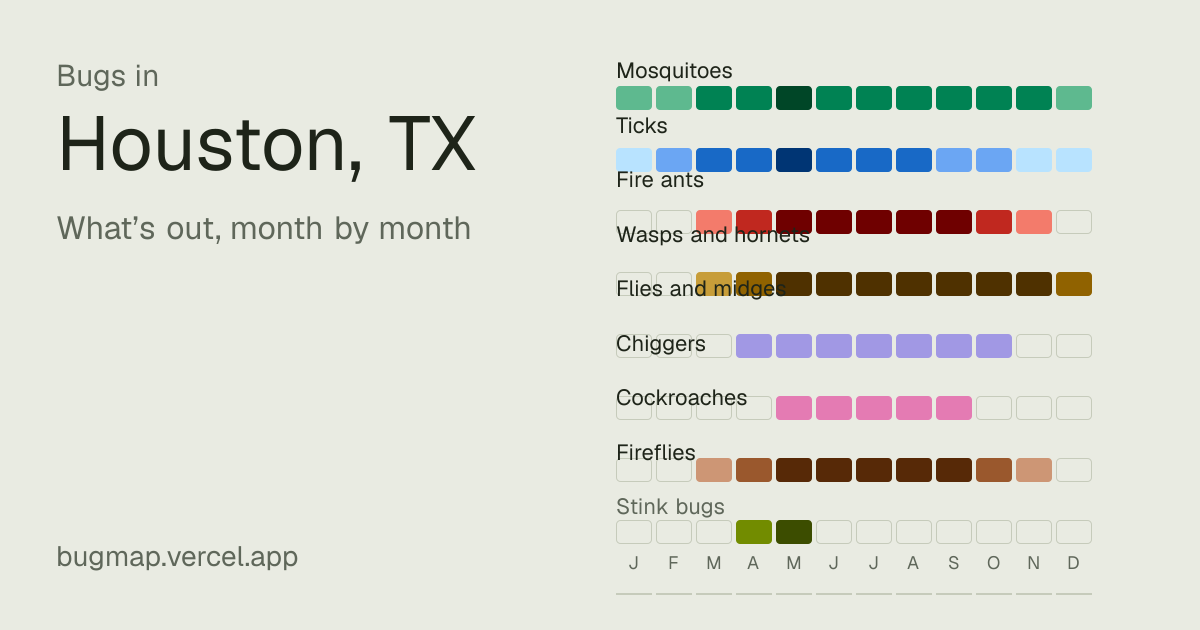
Every city has a card of its year too, at bugmap.vercel.app/og/city-st/place.png, for example Houston’s.
Put the map on your page
The working map, for the country or opened on one city: readers can pick a bug, play the year, and tap through to a state or city. Paste the code into a story; it fits whatever column it’s given and needs no script.